US National & Household Debt continues to mount post pandemic through regimes of Joe Biden to Donald Trump - Despite a good economy in Bidens final year, household debt mounted - Under Trump debt continues to mount due to blowback from Tariffs hitting manufacturing

US debt mounts disproportinately as mortgages, college tution fees & health care costs rise enormously

Household debt in the US has increased alarmingly in terms of groceries , student debt, mortage on housing , health care and child care costs - An analysis shows how Trumps policies impact

The Great American Debt Accumulation: From Balance Sheets to Ballot Boxes

The natiNational debt is at a record high. What happens if it keeps going?
The U.S. gGovernment’s gross national debt – the total amount of money owed its creditors and other financial obligations – hit a record high of more than $38 trillion on Oct. 22, the Treasury Department reported.
That translates to about $111,000 of debt per person in the United States, says the Peter G. Peterson Foundation, a think tank on fiscal policy.
By Ashok Nilakantan Ayers. November 06, 2025
 The consequences of this squeeze were not merely economic—they were profoundly political, helping to shape the contours of the 2024 presidential election in ways that pollsters and pundits initially struggled to grasp. Now they show the blow back in the 2025 elections where every seat that went up for grabs in the 2025 elections , 2 million voters rejected Trumps economic policies that raised costs.
The Architecture of Accumulation
Grocery Shopping Statistics
Last updated: September 1, 2025
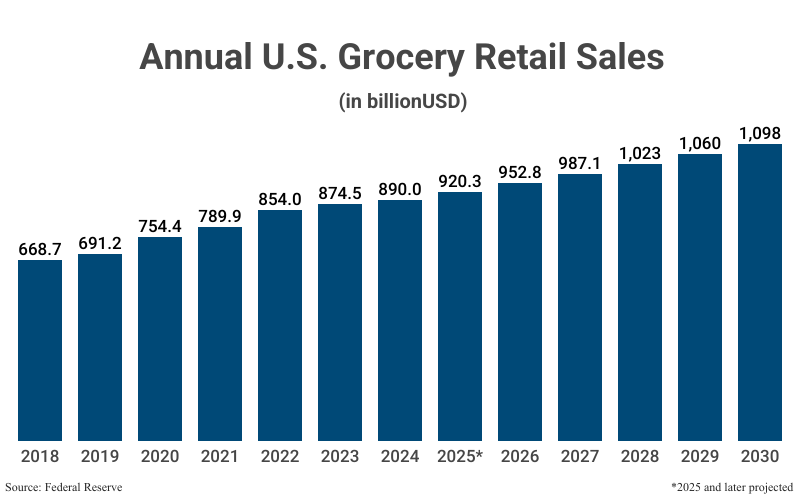
Highlights. U.S. grocery sales will total $920.3 billion in 2025; annual grocery spending will surpass $1 trillion in 2028.
The average American consumer visits the grocery store once every 4.7 days and spends 46 minutes shopping.
Online grocery delivery revenue will total $327.7 billion in 2025, up 27.3% year-over-year (YoY).
U.S. supermarkets and other grocery retailers number 58,674 and carry an average of 33,000 different products
After-tax net profit margins for the average food retailer was 1.7% in 2024.
The ascent has been remorseless. Since the final quarter of 2019, before the pandemic upended the global economy, American household debt has swollen by $4.4 trillion—an increase of nealy 31% in just over five years. This is not the sudden shock of a financial crisis but rather the slow-motion accumulation of obligations across nearly every category of consumer borrowing. 2025 shows no reverse but even more explosive rise in debt due to faultlines in the Trumps economic poilicies.
The Federal Reserve Bank of New York’s quarterly report reveals the anatomy of this burden with clinical precision. Mortgage debt, the largest component, has climbed steadily as house prices surged beyond the reach of ordinary incomes, forcing buyers to stretch their borrowing capacity to secure shelter.
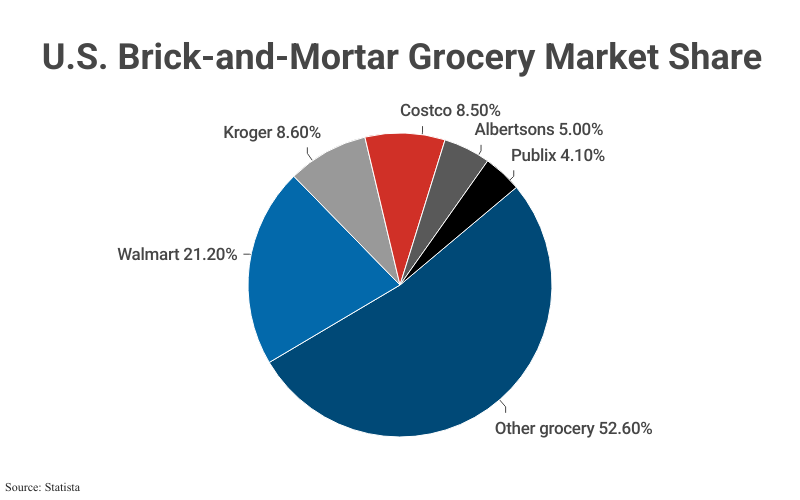
Top 10 Grocery Chains Market ShareStore2025 Market ShareYoY GrowthWalmart21.2%-1.40%Kroger8.6%-4.44%Costco8.5%6.25%Albertsons5.0%-1.96%Publix4.1%2.50%Sam’s Club4.0%2.56%Ahold Delhaize3.9%-4.88%Aldi2.8%0.00%Target2.4%0.00%H-E-B1.9%-5.00%
Warehouse Grocery Statistics
Though they are not generally classified as grocery stores, a significant portion of the U.S. population gets most of their groceries from a superstore or warehouse retailer.
Walmart reported $276 billion in global grocery sales for FY2025.
Walmart’s U.S. e-commerce grocery sales totaled $58.92 billion in 2024.
Amazon* overtook Costco as the 2nd largest grocery retailer in 2023.
For 2024, Amazon reported $100 billion in grocery sales.
*Statistical surveys have varied definitions of what constitutes a warehouse retailer; Amazon does not always qualify.
, Urban, Rural, Homeowning, and Renting according to U.S. Bureau of Labor Statistics")
Credit card balances have reached $1.23 trillion, an all-time peak, reflecting not profligacy but necessity as Americans increasingly rely on revolving credit to bridge the gap between stagnant wages and rising costs. Auto loans hold steady at $1.66 trillion, testament to the fact that in a nation built around the automobile, transportation is non-negotiable—and increasingly expensive.
But perhaps most troubling is the trajectory of student debt, which has climbed to $1.65 trillion. Here, the delinquency figures are particularly alarming: nearly 10% of all student debt is now 90 days or more past due, a sharp deterioration following the resumption of payments after a four-year pandemic pause. An entire generation has been saddled with obligations that delay homeownership, family formation, and wealth accumulation—transforming education from a pathway to prosperity into a decades-long financial albatross.
The Granular Grind
Yet aggregate statistics, however staggering, obscure the lived experience of debt accumulation across specific categories of household expenditure. The pressure points are numerous and mutually reinforcing.
Grocery Consumer Statistics
A typical household’s primary grocery shopper spends 63 hours and 24 minutes per year buying groceries.
88% of U.S. household shoppers drive to their preferred grocery retailer at least once per week.
Consumers live an average of four (4) miles from their preferred grocery store.
The most popular time to shop is on the weekend between 11 a.m. and 1 p.m.; 20% of U.S. consumers visit the grocery store at this time.
Shopping In-store vs. Online
Over 58% of consumers believe the best grocery deals are available at brick-and-mortar locations (vs. online).
38.0% of consumers only grocery shop in brick-and-mortar stores.
28.6% of grocery shoppers do most of their shopping in store.
7.0% of shoppers do most of their grocery shopping online while 1.1% only shop online for groceries.
25.3% of consumers split their grocery shopping evenly between online and in store.
 from 2017 (0.48%) to 2024 (1.82%), with a YTD average for 2025 (-0.15%) according to Statista")
Consumer Cost-Cutting Statistics
A significant portion of consumers have cut costs in the last year.
44.7% of grocery shoppers have made a conscious decision to purchase cheaper brands.
33.7% of grocery shoppers opt for foods that cost less (ex. beans in place of meat).
26.6% of consumers grocery shop at less expensive stores.
26.0% of grocery shoppers simply buy less food.
 to February 2025 ($10.3) according to Statista")
Grocery Spending Statistics
As of February 2025, average weekly grocery spending per household may be as high as $170.
The average U.S. household spent $6,516 on groceries in 2024.
In a typical week, the average U.S. household spent $125.31 on groceries.
Weekly grocery spending is $50.33 per capita, so a family of four may expect to spend about $200 per week on groceries.
An average household also spent $24.89 on delivery or other non-grocery food-at-home in a typical week.
99% of households purchase frozen foods.
73% of household grocery shoppers purchase plant-based alternative foods at least occasionally.
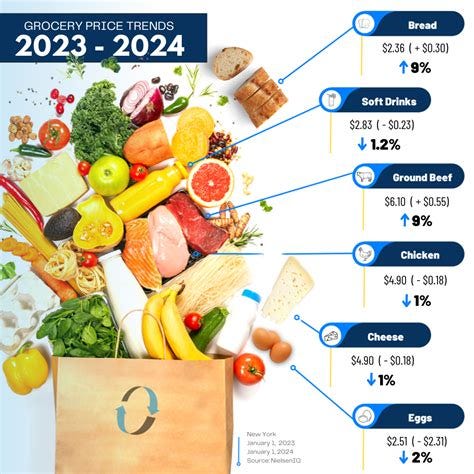
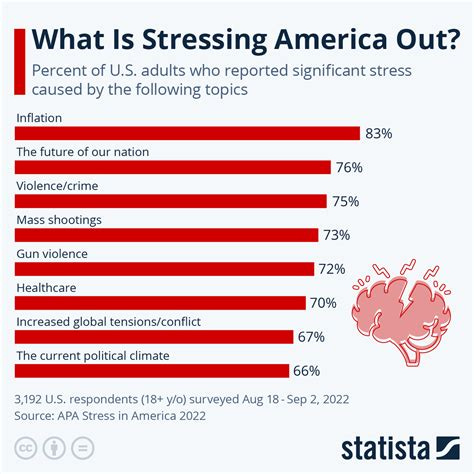
Groceries and essentials have been a particular source of anguish. Food price inflation peaked at over 11% year-on-year in 2022, the sharpest increase in four decades. Though inflation has moderated, prices have not retreated; they have merely stopped rising quite so quickly. For families earning median incomes, the weekly shop has become a source of anxiety, with many resorting to credit cards to cover basic provisions—a practice that would have seemed desperate a decade ago but has become disturbingly commonplace. 2025 has only helped to maintain the momentum instead of a reversal.
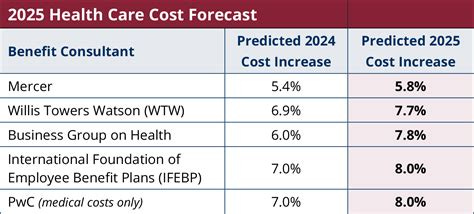
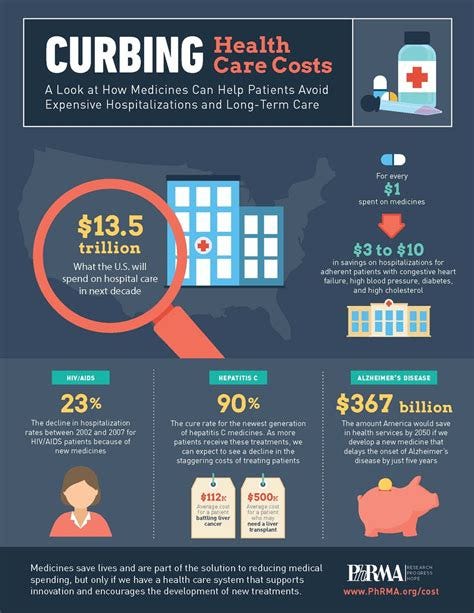
Healthcare costs continue their inexorable climb, with Americans now carrying an estimated $220 billion in medical debt. Even those with insurance face deductibles and co-payments that can run into thousands of dollars for serious illnesses or injuries. The choice between treatment and financial ruin is not hypothetical for millions of families. Cut in medicaid has made matters worse as the US congress see the longest shutdown in american history as Democrats lock horns with Republicans who refuse to yield to concessions on medicaid to pass legislations.
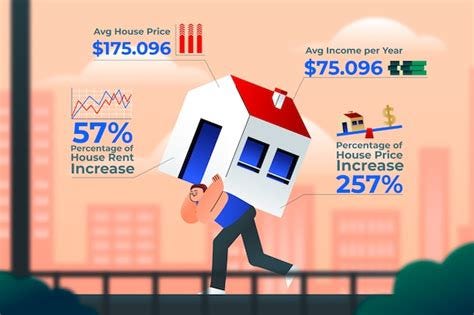
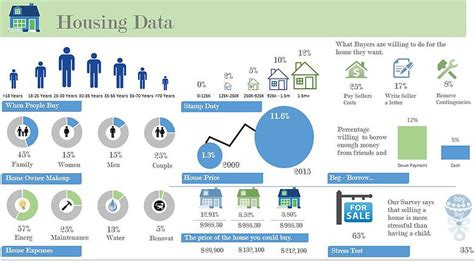
Housing costs have become the defining financial challenge for a generation. Rent has surged across urban America, consuming 30%, 40%, even 50% of household income for those unable to secure homeownership. For those who do buy, mortgage payments have swollen as interest rates climbed from pandemic-era lows. The 30-year fixed mortgage rate, which hovered around 3% in 2021, exceeded 7% by late 2023, effectively pricing millions out of the market or forcing them into precarious financial positions. There has been no change as the crisis continues and there are no first time buyers or 2nd time buyers who are waiting and watching for mortgage rates to fall below the 6% mark.
The rent freeze campaign by democratic socialist Zohran Mamdani won the New York city mayorship.
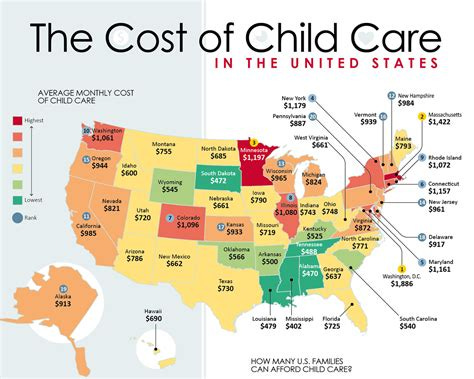
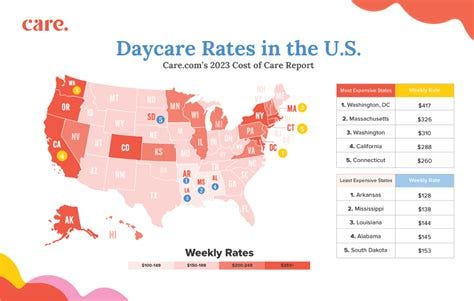
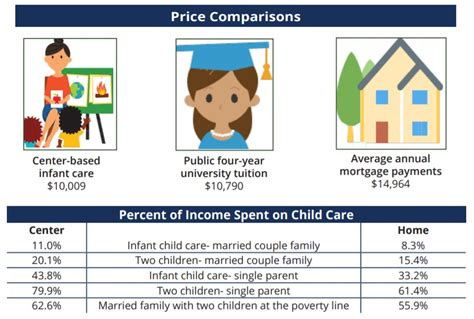
Childcare expenses represent another crushing burden, particularly for working families. In many states, the annual cost of infant care exceeds the price of in-state university tuition—a perverse inversion of priorities that forces parents into impossible trade-offs between career advancement and family care.
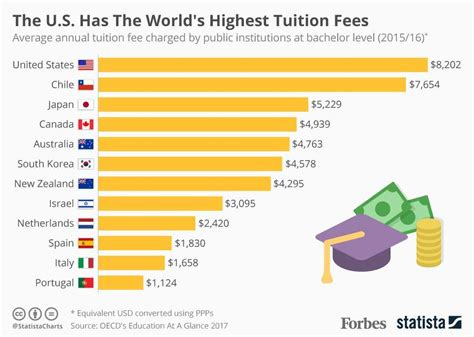
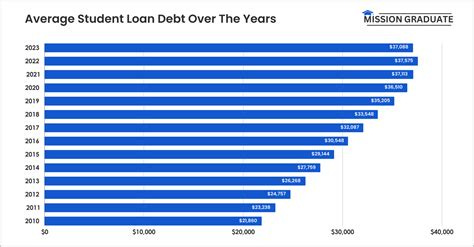
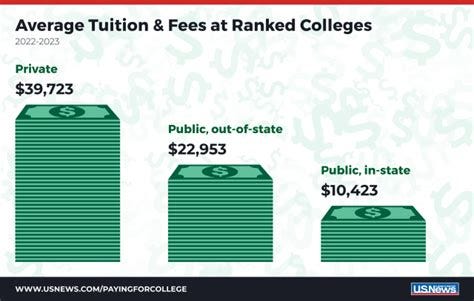
College tuition fees have been climbing faster than inflation for decades, creating a multi-generational debt trap. The average student now graduates owing $30,000 or more, with many professional degrees requiring six-figure borrowing. This debt reshapes life trajectories, discouraging entrepreneurship and risk-taking while channeling graduates toward whatever employment can service their obligations.
Joe Biden during his presidency tried to implement a loan forgiveness programme which was however rejected by the countrys apex court.
The Political Transmutation

Economic anxiety does not remain
confined to spreadsheets and bank statements. It metastasizes into anger, resentment, and a hunger for change—any change. The 2024 presidential election became, in substantial part, a referendum on this accumulating financial pressure. But the 2025 elections was an even more greater blowback as promises to reduce prices and contain them were not only not redeemed but only enabled a further rise in debt.
Donald Trump’s victory over Kamala Harris was built, among other factors, on a foundation of economic discontent. Exit polls revealed that voters who described the economy as their primary concern broke decisively for Trump, despite—or perhaps because of—his heterodox policy positions. His promise of tariffs, mass deportation, and a fundamental reshaping of trade relationships was less important than the simple acknowledgment that the system was not working for ordinary Americans.
But the 2025 elections resulting in a democratic sweep demonstrates that Trump was unable to do any course corrections from what he calimed was a bad economy inherited from Joe Biden due to his economic policies — Trumps; policues instead of alleviating the peoples woes has only helkped to compound them.

The Biden administration’s economic messaging had emphasized macroeconomic indicators: falling unemployment, rising GDP, moderating inflation. These were not fabrications—by traditional measures, the economy was performing reasonably well. But aggregate statistics cannot capture the experience of families whose debt loads became unsustainable as purchasing power eroded and the sense of forward progress stalled.
Harris, as the incumbent vice president, inherited this messaging challenge. Her campaign emphasized middle-class tax credits, housing assistance, and healthcare reform—sensible policies thatnonetheless failed to generate the visceral response that comes from acknowledging voters’ lived reality.

Trump, by contrast, spoke in the language of grievance and promised disruption. For voters drowning in debt and desperate for relief, disruption held its own appeal. But 2025 results have shown his economic policies have not corrected this anomaly but only compounded them.

The K-Shaped Reality
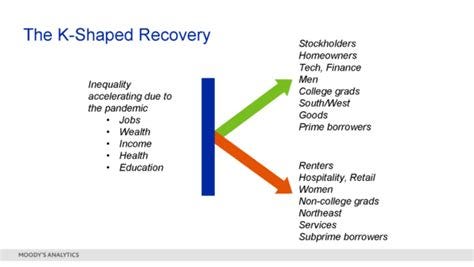
Analysts have taken to describing America’s economic recovery as “K-shaped”—a configuration in which different segments of society diverge sharply, with some ascending while others sink. This pattern is clearly visible in household debt data. Affluent families, many of whom benefited from asset price inflation during the pandemic, have strengthened their balance sheets. Their debt, where it exists, is often strategic—mortgages on appreciating properties, manageable credit card balances paid off monthly.

For lower-income and younger households, the trajectory is starkly different. These families carry debt not as a financial tool but as a survival mechanism, a way to maintain consumption amid stagnant wages and rising costs. Their delinquency rates are climbing, particularly for auto loans and credit cards, suggesting that for a significant minority of Americans, debt has become unsustainable.
This bifurcation has profound political implications. It creates two Americas with fundamentally different economic experiences, making consensus increasingly difficult to achieve and populist appeals increasingly potent.
Looking Forward
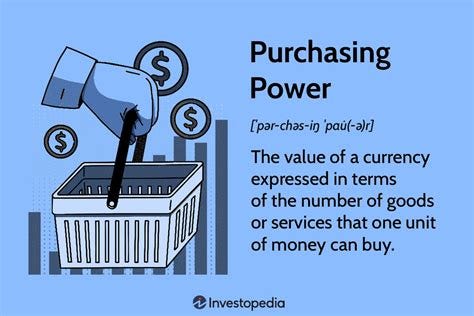
The U.S. economy has made considerable progress in 2023. Inflation is down six percentage points from its peak in 2022. At the same time, real wages are rising and unemployment remains historically low. But despite the significant progress on inflation, Americans continue to feel the pain of higher prices. President Biden’s economic agenda focuses on giving middle class families more breathing room. That means helping reduce the cost of goods and services, and even more importantly, increasing household incomes. When incomes rise faster than prices, households can afford more: they have more purchasing power. This is precisely the trend we have seen in the United States since the pandemic. Thanks to rising real wages (wages adjusted for inflation) and rising employment, the typical American can afford more goods and services than before the pandemic.
This blog explores the interplay of wages, employment, and prices to unpack this dynamic. We offer four key conclusions:
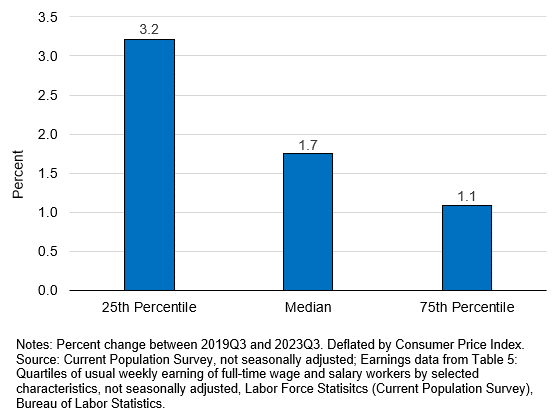
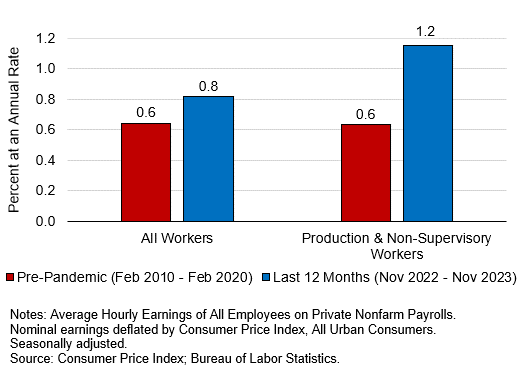
Real wages have risen since before the pandemic across the income distribution. In particular, middle-income and lower-income households have seen their real earnings rise especially fast. And in the past 12 months, real wages overall have grown faster than they did in the pre-pandemic expansion.

Household purchasing power has increased as a result. In 2023, the median American worker can afford the same goods and services as they did in 2019, plus an additional $1,000 to spend or save—because median earnings rose faster than prices.
The U.S. economy now has over 2 million more jobs than pre-pandemic forecasters expected. Therefore, more and more workers are benefitting from increased purchasing power, thanks to the strong and resilient labor market.[1]
This pattern of rising purchasing power is particularly American: other advanced economies have generally seen lower, and in many cases negative, real wage growth.
The household debt burden is not merely a cyclical phenomenon that will naturally recede with economic growth. It reflects structural imbalances: the financialization of higher education, the failure of housing supply to keep pace with demand, the inadequacy of wage growth relative to productivity gains, and the steady transfer of risk from institutions to individuals.
Trumps economic policies including tariffs might have filled the coffers of the US treasuries by billions but the rising costs of local manufacturing and low job hires and job losses raised the house hold kitchen table costs by an average $1300 per annum forcing middle class families to stretch themselves on daily essentials.
Addressing these imbalances would require policy interventions that are politically difficult and economically complex—reforms to student lending, housing finance, healthcare delivery, and labour market institutions. In the meantime, Americans will continue to borrow, to struggle, and to carry their frustrations to the voting booth.
The 2025 showed frustrations at no reversal of the 2024 phenomena by a president they elected to reengineer economic policies for their benefit, but they benefitted billionaires only at the cost of the people who voted Trump and the dramatic reversal was seen in New York, Virginia, New Jersey, Pennsylvania and California — coast to coast not auguring well for the Republicans who control both the houses of legislature The house at 220 to 215 razon thin majority and the Senate at 53 yo 47 majority — a trifecta including the presidency.
If the trend continies well into 2026, the Republicans are bound to lose the house of reps and lose some seats in the senate to reduce their majority. Its a wake up call for the GOP leaders backing Trump and his economic policies which have not yielded the necessary results — filling up the treasury is not enough but it has to help in reducing prices and the inflationary debt of the house hold.
The record $18.59 trillion in household debt is not merely an economic statistic. It is a measure of stress, anxiety, and diminished possibility—and a harbinger of political turbulence yet to come.


Comments
Post a Comment